Amazon FBA Product Fee Checker
Yes, absolutely! A new sheet will have to be created since most of our spreadsheets are locked for editing to prevent things from breaking. You can still pull in data from any cell by referencing it in your formula.
Just follow these steps:
- At the bottom, middle of the spreadsheet, click the + next to the right of the sheets tabs to add a new sheet
- Click the triangle in the upper left next to cell A1
- Right Click and select “Format Cells”
- Select the Protection tab and uncheck “Locked” (this prevents the new sheet from being password protected when updating data)
- Add whatever you want to the new sheet.
Be sure to uncheck “Locked” before clicking update on the dashboard. Otherwise, the cells will be locked on the new sheet and you won’t be able to see the Protection tab under Format Cells.
On the SalesData sheet the Referral % field calculates the referral percentage from column R, selling fees / column M, product sales. The FP Ref % is the referral percentage calculated from the FeePreview data. This is simply a reference to see if the referral percentages are different between the two. This will only happen when the item was moved to a product group where the referral fees are different. Keep in mind that the percentage can be higher than the product group referral percentage when there is a minimum referral fee (usually $1). Ref. Dif? will say “Yes” when the difference between the two if greater than 5%. This result is not reported on the Order Summary report.
To calculate what belongs on Fee Check Summary, we take the standard deviation of all length + girth and weights fields for all items. These calculations are displayed on the far right of FeePreview. Any items that have greater than 3 times (3z) the standard deviation of both of these goes into the Fee Check Summary.
These items should be physically measured and weighed to check the accuracy of what Amazon has listed. Take a picture or two to prove to Amazon seller support if, in fact, your measurements or weight are different.
Recoverable Fees are calculated based on the total difference between FBA fees and FeePreview when Problem = Yes. This could actually be considerably more if you were charged incorrect fees, but the item was not in the FeePreview data to verify the fees against our Threshold calculations.
Problem = Yes: FBA fees were more than both the Threshold and FeePreview. There was definitely something different with orders marked yes, and they should be investivated.
Problem = Maybe: FBA fees for this order were more than the Threshold OR FeePreview. This may be because of an incorrect fee, and we didn’t have a whole lot of data to go on, or because of a FBA fee change. There isn’t necessarily an issue, but you should check to be sure.
Problem = Decreased: FBA fees were less than what is listed in FeePreview. This is probably because the fees were recently adjusted for that item due to a weight or dimension change. That means the fees could currently be incorrect and this tool did not pick up on it because it thinks those fees are normal. Orders with a quantity more than 1 are filtered. Regardless, you should investigate why the FBA fees are less.
This is the “adjusted FBA fees”. Column S ‘fba fees’ contains shipping and gift wrap totals. These are subtracted from the adjusted fba fee. Multi-channel fulfillment orders are also excluded since the fees are not consistent with regular fba fees. These orders have an Order-ID beginning with ‘S’. We account for orders that received a promotional discount as well. In other words if you gave out a coupon code, that amount is subtracted from the fee total.
Also, we’ve tried to take into account orders with multiple quantities. The adjusted fee divides by the quantity as to make the fee per item rather by order. Any change in fees will have to be greater than the calculated threshold to trigger an issue regardless of how many items are in an order.
The threshold figure you see on the Order Summary and Sales Summary is calculated by taking the average of all FBA fees for an item + the standard deviation of those fees. If there the standard deviation on the Sales Summary sheet is $0.00 for an item, that means the fees were always the same in the sales data (they didn’t deviate). You can see a summary of the averages and standard deviations for each item on the Sales Summary sheet.
This report is to compare older Fee Preview reports to the newer one in FeePreview. The results of the differences are outlined in FeePreview Compare. Simply download and load an older report as you did in the steps for FeePreview.
The FBA fees from FeePreview2 are used if, and only if, FBA fees cannot be found in FeePreview for the particular sku. If the item is not found in either report you will see the error “Not in FP/FP2“
For SalesData:
- Go to Reports > Payments > Date Range Reports (tab) > Generate a report. or click here
- Under “Select report type” select Transaction
- Select Custom for the reporting range and choose the dates that you would like to analyze, then click Generate
- After the report is generated, download it to a known folder on your computer
- Open the SalesData sheet and click “Import/Update Sales Data” on the top left. Select the report you just downloaded and click OK
The SalesData sheet will handle a MAX of 10,000 records. If Excel is crashing, try reducing the amount of sales you are importing. Please be patient.
For FeePreview:
- Go to Reports > Fulfillment > Payments > Fee Preview. or click here
- Click Request Download to get the latest data. Download the report to a known folder on your computer when it is complete.
- Go to the FeePreview sheet and click “Import/Update Fee Preview” on the top left. Select the report you just downloaded and click OK
The lite version of the Reimbursement Checker, Inventory Value Calculator, and Tax Summary spreadsheets will work with LibreOffice or OpenOffice, with the exception that you’ll have to manually paste in the reports that are downloaded from Amazon.
Unfortunately, the macros and pivot tables that are used in all other spreadsheets will not run properly in LibreOffice, OpenOffice, or Google Sheets.
Some sheets in our spreadsheets are locked for editing to make sure that certain underlying formulas aren’t accidentally deleted. If you simply need to copy data, you may have gotten the password message when right clicking on a cell. Instead, simply ctrl+c to copy.
If you would like to edit or remove data, we recommend either using the filter option drop down located at the top of the column next to the heading, or removing data from a file before importing. If you choose the latter, it may be easier to import it into a another (new) spreadsheet first, remove data, save as the same file type, then re-import into the spreadsheet.
If you want to add your own calculations/data to a spreadsheet, you can still do so by following these steps.
Amazon FBA Refund & Lost Inventory Reimbursement Checker
The auto-import feature uses Internet Explorer to literally go into Seller Central, request the reports, and download them. In some cases we get the data directly from the page (like shipping data). This process requires that you have Internet Explorer (at least v11), and a stable internet connection. The auto-import feature will not work with Excel for Mac.
There are a few things that could, and sometimes do, go wrong:
- When saving a file we have to use what is called ‘SendKeys’ to click some buttons. If this process is interrupted when a key is pressed, or an IE window goes out of focus, it can trip up the macro. There is no easy way to recover from this other then skipping the file, and moving on. It is best to not use your computer when the import is running.
- Seller Central failed to load within 10 seconds, and data was skipped. Check your internet connection to be sure.
- Amazon changed something on a page that we were looking for. This happens from time to time. Recently Amazon put a limit on the amount of sales data that could be downloaded per report to 180 days.
If 1 or 2 happens, simply run the auto-import again, and the missing data will try to download. If an item simply refuses to download, open a support ticket so we can take a look.
Yes, absolutely! A new sheet will have to be created since most of our spreadsheets are locked for editing to prevent things from breaking. You can still pull in data from any cell by referencing it in your formula.
Just follow these steps:
- At the bottom, middle of the spreadsheet, click the + next to the right of the sheets tabs to add a new sheet
- Click the triangle in the upper left next to cell A1
- Right Click and select “Format Cells”
- Select the Protection tab and uncheck “Locked” (this prevents the new sheet from being password protected when updating data)
- Add whatever you want to the new sheet.
Be sure to uncheck “Locked” before clicking update on the dashboard. Otherwise, the cells will be locked on the new sheet and you won’t be able to see the Protection tab under Format Cells.
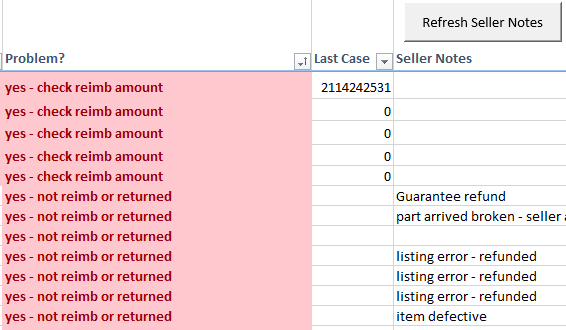
Unfortunately there is no way to tell who processed a refund in the report data. Because of this refunds that you manually processed will show up in the Refunds report as a problem: “not reimb or returned”.
There is, however, one way this can be remedied. We recently included a feature to import seller notes from the order detail page (for PC users). If you don’t already, when manually refunding a customer, be sure to put in a note to indicate that it was done by you. This way there will no confusion over what returns should be looked into.
If the number in Total Discrepancy is greater than 0 for an individual SKU, open a case with Seller Support under Selling on Amazon > Fulfillment by Amazon > FBA Issue > Something else. You’ll want to provide as much information as possible to make the process easier for them.
- Explain what SKUs (or FNSKUs) have been lost/damaged
- Explain that it has been 45 days since the items were lost/damaged
- The quantity that has been lost/damaged
- The date inventory was last lost/damaged. (look at the Inventory Adj sheet for this – In v2.0, double click on the last adjustment to filter the report by SKU)
- The estimated amount you believe you should be reimbursed per SKU (optional)
If you have a lot of different SKUs that were lost/damaged you should do them in batches of no more than 10 SKUs or so. We don’t want to overwhelm Amazon support. That and this will make it easier to track in the future.
Here is a template that can be used:
Hello!
I’m showing that the following inventory was lost or damaged in a fulfillment center, but it was never reimbursed for:
Date – SKU – Quantity
9/18/2016 – SKU1 – 1
7/13/2016 – SKU2 – 1
7/11/2016 – SKU3 – 1
8/3/2016 – SKU4 – 1
11/01/2016 – SKU5 – 1Since it has been more than 45 days since these items were lost or damaged, I would appreciate a reimbursement per Amazon’s FBA Lost and Damaged Inventory Reimbursement Policy. Please let me know if there is any other information I can provide!
Thank you!
The following reports are used in the Refund & Lost Inventory Reimbursement Checker (you may have to copy/paste the URLs since Amazon no longer allows direct linking)
- Sales Data (for refunds) – https://sellercentral.amazon.com/payments/reports/custom/request
- Inventory Adjustments –https://sellercentral.amazon.com/gp/ssof/reports/search.html#orderAscending=&recordType=INVENTORY_ADJUSTMENT
- Reimbursements – https://sellercentral.amazon.com/gp/ssof/reports/search.html#orderAscending=&recordType=REIMBURSEMENTS
- Returns – https://sellercentral.amazon.com/gp/ssof/reports/search.html#orderAscending=&recordType=CUSTOMER_RETURNS
Lost FC – Inventory lost in a fulfillment center
Date Last Lost FC – The date the last item was lost in a fulfillment center
Lost Ship – Inventory lost during shipping to a fulfillment center – these items are almost always reimbursed because of a reconciliation case
Damaged FC – Inventory damaged in a fulfillment center
Date Last Dam FC – The date the last item was damaged in a fulfillment center. Does not include “Damaged – miscellaneous”
Damaged Ship – Inventory damaged during shipping to a fulfillment center – these items are almost always reimbursed because of a reconciliation case
Total Found – Inventory previously lost, but found
From Holding – Inventory transferred from a holding account in order to reimburse you for lost or damaged inventory
Lost/Dam Diff – The difference between all inventory lost & damaged, and inventory found & reimbursed
Inv Adj. Difference – The total if you add up all of the inventory quantity counts on the Inventory Adjustment sheet that are SELLABLE for the given SKU
Reimb Lost – Inventory lost that was reimbursed for – double click to view
Reimb Damaged – Inventory damaged that was reimbursed for – double click to view
Total Reimbursed – – The total you have previously been reimbursed for this item
Total Discrepancy – The total difference between all lost & damaged, found, from holding, and reimbursed.
A negative value means either:
- – you were reimbursed more than once for the same item
- – there is a gap in data and an item was lost/damaged before the data starts
- – Amazon counted one or more “From holding” transfers as a Reimbursement – In other words, they sometimes say “Transfer from holding account” on the Inventory Adj report and there is a “quantity-reimbursed-inventory” on the Reimbursements report, but not always. It seems to depend on the situation.
Total Owed – The estimated total of reimbursements that Amazon owes you based on the total discrepancy and previous reimbursements – This can only be calculated if there are previous reimbursements for this item
Last Inventory Adjustment – The description of the last inventory adjustment – double click to view all for this SKU
Last Case? – If there was a case with seller support opened previously, the last ID will show up here. This means you opened a case or reconciled inventory related to this SKU previously. Double click to view all cases.
Problem? – There is definitely an issue, and a case to seller support should be opened. This means that the last date an item was lost or damaged was greater than 45 days ago. If there are multiple items lost or damaged, and the last one was lost less than 45 days ago, the row will not be highlighted, but it’s very possible there is still inventory that should be reimbursed for.
The lite version of the Reimbursement Checker, Inventory Value Calculator, and Tax Summary spreadsheets will work with LibreOffice or OpenOffice, with the exception that you’ll have to manually paste in the reports that are downloaded from Amazon.
Unfortunately, the macros and pivot tables that are used in all other spreadsheets will not run properly in LibreOffice, OpenOffice, or Google Sheets.
Some sheets in our spreadsheets are locked for editing to make sure that certain underlying formulas aren’t accidentally deleted. If you simply need to copy data, you may have gotten the password message when right clicking on a cell. Instead, simply ctrl+c to copy.
If you would like to edit or remove data, we recommend either using the filter option drop down located at the top of the column next to the heading, or removing data from a file before importing. If you choose the latter, it may be easier to import it into a another (new) spreadsheet first, remove data, save as the same file type, then re-import into the spreadsheet.
If you want to add your own calculations/data to a spreadsheet, you can still do so by following these steps.
v1.0 will work with Google Sheets, but v2.0 will not.
However, for v1.0 to work with Google Sheets, you must copy/paste in the reports manually as the macros that support importing data will not work.
The refund report we use from Amazon has a max of 600 items. To get more data than this you will have to run more than one report with different date ranges. Amazon typically will give you the most recent 600 items, so you will have to run more reports for the older data.
To do this for v1.0:
- Go to Reports > Payments > Transaction View (tab)
- Select Custom date range
- Select a To: date that is a day before the data begins on the last report you ran.
- Filter view by: Refund
- Click download (below “update”, to the right) – make sure to save it in a known location on your computer
- Open this file in notepad (or similar) and copy all data after the first row
- Open the Refunds sheet in the spreadsheet and select the last open cell in column A
- Right click and Paste the data that you previously copied
- Check to make sure there are no gaps in data – for example, you selected a ‘from’ date of Jan 1st, but there is only data going back to May 1st. This means you exceeded 600 records, and need to select a shorter date range
- Repeat the process for dates before the ones you selected in the 2nd step
- To make everything easier to read click the down arrow for column E, Payment Type, click ‘(Select All)’, then click ‘Product Charges’ to filter
To do this for v2.0:
- Go to Reports > Payments > Transaction View (tab)
- Select Custom date range
- Select a To: date that is a day before the data begins on the last report you ran.
- Filter view by: Refund
- Click download (below “update”, to the right) – make sure to save it in a known location on your computer
- Import the report into the Refunds sheet by clicking Import/Update
- Repeat the process for dates before the ones you selected in the 2nd step
Either Amazon has lost a lot of your inventory, or there is an overlap in the data. If there are a lot of discrepancies in the beginning of the report, the former is more likely.
To fix this, and make the report more accurate you should filter out lost inventory that has been lost in the past 45 days. Amazon doesn’t reimburse for lost/damaged inventory for at least 45 days from the time it was reported lost/damaged.
To do this:
- Go to the Inventory Adj sheet
- Find column H (reason), hit the down arrow in the header
- Click select all, so everything is un-selected, then click ‘M’. Now only records with M as the reason show show up.
- Click cell A2 and drag to I2
- Hit shift, then the down arrow to select down
- Keep hitting the down arrow until all records from the past 45 days are selected
- Hit delete on your keyboard
- Click the arrow again from column H, select “Clear filter from “reason””
Total Discrepancy is the total difference between all lost & damaged, found, from holding, and reimbursed.
0 means you have already been reimbursed.
A negative value means either:
- you were reimbursed more than once for the same item
- there is a gap in data and an item was lost/damaged before the data starts, but there is data showing items were found
- Amazon counted one or more “From holding” transfers as a Reimbursement – In other words, they sometimes say “Transfer from holding account” on the Inventory Adj report and there is a “quantity-reimbursed-inventory” on the Reimbursements report, but not always. It seems to depend on the situation.
General
Yes, absolutely! A new sheet will have to be created since most of our spreadsheets are locked for editing to prevent things from breaking. You can still pull in data from any cell by referencing it in your formula.
Just follow these steps:
- At the bottom, middle of the spreadsheet, click the + next to the right of the sheets tabs to add a new sheet
- Click the triangle in the upper left next to cell A1
- Right Click and select “Format Cells”
- Select the Protection tab and uncheck “Locked” (this prevents the new sheet from being password protected when updating data)
- Add whatever you want to the new sheet.
Be sure to uncheck “Locked” before clicking update on the dashboard. Otherwise, the cells will be locked on the new sheet and you won’t be able to see the Protection tab under Format Cells.
Enable them! The spreadsheet needs them to function correctly!
This warning comes up because the Spreadsheet connects to local Amazon reports (that you’ve previously connected to the spreadsheet), and because macros are used. You’ll want to click Enable Content. Otherwise, the spreadsheet will not update correctly after data is added.
The lite version of the Reimbursement Checker, Inventory Value Calculator, and Tax Summary spreadsheets will work with LibreOffice or OpenOffice, with the exception that you’ll have to manually paste in the reports that are downloaded from Amazon.
Unfortunately, the macros and pivot tables that are used in all other spreadsheets will not run properly in LibreOffice, OpenOffice, or Google Sheets.
Some sheets in our spreadsheets are locked for editing to make sure that certain underlying formulas aren’t accidentally deleted. If you simply need to copy data, you may have gotten the password message when right clicking on a cell. Instead, simply ctrl+c to copy.
If you would like to edit or remove data, we recommend either using the filter option drop down located at the top of the column next to the heading, or removing data from a file before importing. If you choose the latter, it may be easier to import it into a another (new) spreadsheet first, remove data, save as the same file type, then re-import into the spreadsheet.
If you want to add your own calculations/data to a spreadsheet, you can still do so by following these steps.
More than likely, no. The formulas and macros that we use will not work properly with Mac Numbers. We would recommend using Excel for Mac instead.
It sounds like you have macro’s disabled. Follow these steps in Excel:
- Click the File tab.
- Click Options.
- Click Trust Center, and then click Trust Center Settings.
- In the Trust Center, click Macro Settings.
- Select an option that will allow Macros to run.
- Click OK.
We are also Amazon FBA sellers. Our products came out of the frustration of not having a tool for FBA to track our data that wasn’t $50+ a month. Not to mention, with those services you’re basically handing over your data to anyone that works there. We really wanted something we could control and easily have available.
The spreadsheets that were available were fundamental, and a lot of data had to manually be entered. Knowing what we know about Excel, and what it can do, we started working. The Ultimate FBA Sales spreadsheet took about a month to get to something that worked. Initially there were so many formulas that the spreadsheet was freezing every time something was changed. We had to rework everything using different methods, like pivot tables and macros to do some of the heavy lifting. We continue to add features and optimize the code in all of our products.
Within a period of 30 days from the purchase date, if for any reason you are unhappy with our products, you can request a full refund.
The Ultimate Amazon FBA Sales Spreadsheet v2
The auto-import feature uses Internet Explorer to literally go into Seller Central, request the reports, and download them. In some cases we get the data directly from the page (like shipping data). This process requires that you have Internet Explorer (at least v11), and a stable internet connection. The auto-import feature will not work with Excel for Mac.
There are a few things that could, and sometimes do, go wrong:
- When saving a file we have to use what is called ‘SendKeys’ to click some buttons. If this process is interrupted when a key is pressed, or an IE window goes out of focus, it can trip up the macro. There is no easy way to recover from this other then skipping the file, and moving on. It is best to not use your computer when the import is running.
- Seller Central failed to load within 10 seconds, and data was skipped. Check your internet connection to be sure.
- Amazon changed something on a page that we were looking for. This happens from time to time. Recently Amazon put a limit on the amount of sales data that could be downloaded per report to 180 days.
If 1 or 2 happens, simply run the auto-import again, and the missing data will try to download. If an item simply refuses to download, open a support ticket so we can take a look.
Yes, absolutely! A new sheet will have to be created since most of our spreadsheets are locked for editing to prevent things from breaking. You can still pull in data from any cell by referencing it in your formula.
Just follow these steps:
- At the bottom, middle of the spreadsheet, click the + next to the right of the sheets tabs to add a new sheet
- Click the triangle in the upper left next to cell A1
- Right Click and select “Format Cells”
- Select the Protection tab and uncheck “Locked” (this prevents the new sheet from being password protected when updating data)
- Add whatever you want to the new sheet.
Be sure to uncheck “Locked” before clicking update on the dashboard. Otherwise, the cells will be locked on the new sheet and you won’t be able to see the Protection tab under Format Cells.
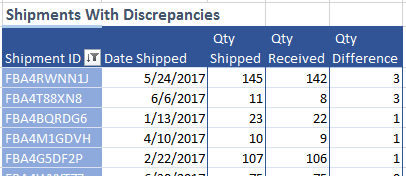
Yes! As long as you’ve imported all of your FBA shipment data on the FBA Shipping Data sheet, there is a report on FBA Shipping Sum, “Shipments With Discrepancies” that will show shipments that had differences in received quantities with what you shipped to Amazon. A positive Qty Difference are ones you should be concerned about. You can simply copy the Shipment ID into the search on the Manage FBA Shipments page
This can happen if the Amazon data is in one format, but your regional settings on your computer, which Excel uses, are in a different format. The dates in the Amazon data need to match the date format on your computer.
For example, you have US Amazon data, so dates will be converted so Excel can use them to m/d/yyyy, but you are in the UK, so your computer is setup with dates in the format d/m/yyyy. This confuses Excel.
Here’s how to fix it: (via How to change date format in Excel and create custom formatting)
- On your computer, Go to Control panel and click Region and Language. If in your Control panel opens in Category view, then click Clock, Language, and Region > Region and Language > Change the date, time, or number format.
- On the Formats tab, choose the region under Format, and then set the date and time formatting by clicking on an arrow next to the format you want to change and selecting the desired one from the drop-down list:
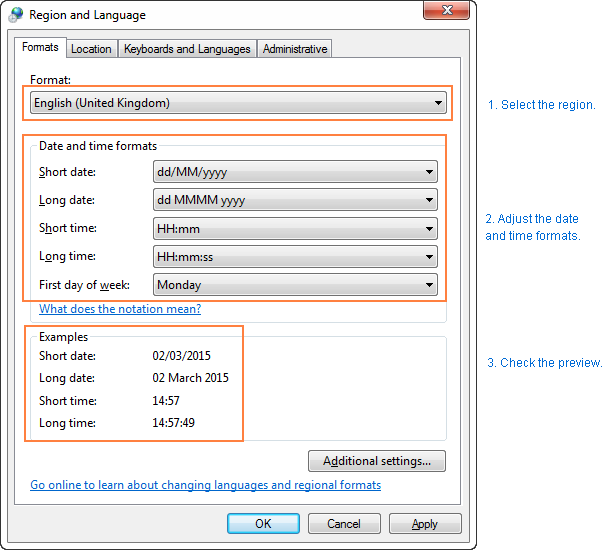
If you are in the UK, loading US Amazon data, choose “English (United States)” at the top, and click Apply.
You may need to download a fresh copy of the spreadsheet after applying these settings! Things may have broken on the back end!
Dates should now be in the correct format on your spreadsheet.
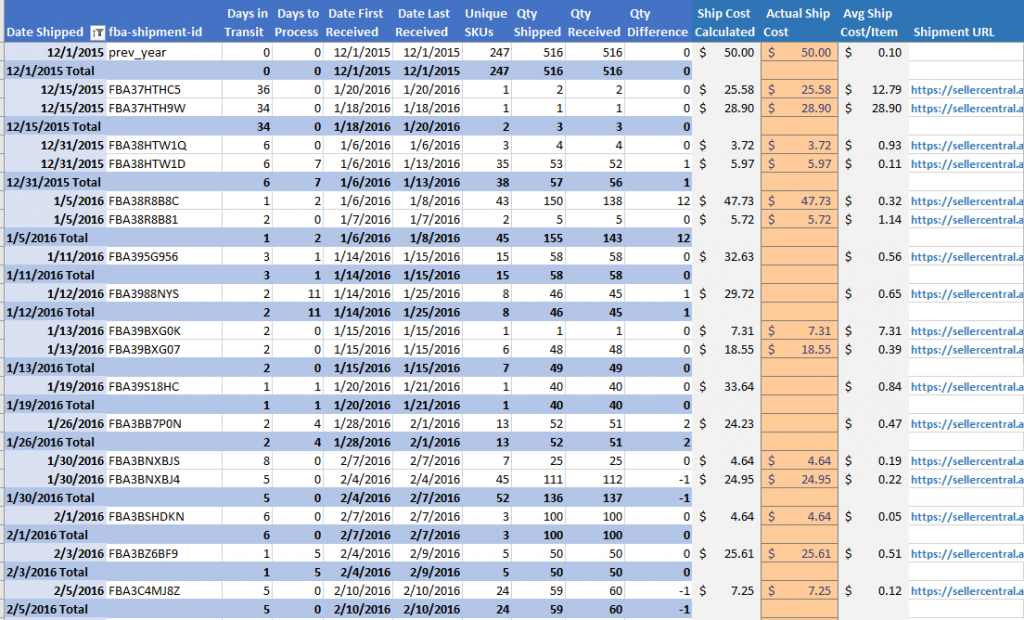
There are several reasons the inbound shipping cost could not be calculating correctly:
- On the FBA Shipping Data sheet – check to make sure the Ship Cost Calculated column is populating. It is only populated if the Date Shipped is the previous day that you were charged for the shipping (or if you fill in Actual Ship Cost). This data is only available in the sales data and shows up as “FBA Amazon-Partnered Carrier Shipment Fee”. If there was more than one shipment on the same day, the total shipping cost is added together, and the sum of the Qty Received (total qty for that date) is averaged to get Avg Ship Cost/Item.
- The dates in “Import Shipping SKU Lists” are missing or incorrect. This could be because the dates were removed from the shipment name when the shipment was created, or the dates are in a format that the spreadsheet does not recognize. (it will recognize US and UK dates, and dates in the format 1/1/17, 1.1.17, and 1-1-17)Normally the Name of a shipment looks like this: FBA (1/1/17 12:00 AM) We recommend, when creating a shipment in Seller Central, to leave the date in tact.
If you do not have dates in your shipment SKU lists (tsv files), the only way to fix this is to edit the files and enter the date manually next to “Name” in the .tsv files. Unfortunately, there is no other way to get this date from Amazon data. Worst case, your “Days in Transit” will be incorrect.
*Update for v2.23 – If you are using the auto-import & dates are not formatted correctly in the TSV files, the spreadsheet will use the dates directly from the Amazon FBA Shipments page.
To automatically get the Actual Ship Cost:
The Actual Ship Cost will populate automatically with the auto-importer when clicking to update all data, just the FBA shipping data, or by clicking “Auto Import Shipping Costs” on the FBA Shipping Data sheet. The manual processing fees and labeling & prep fees are added into the total shipping cost.
To manually enter Actual Ship Cost:
“Actual Ship Cost” can be manually entered on the FBA Shipping Data sheet if you want more accurate shipping cost per item. Cells that are red in column BD need a value filled in. The shipping cost can be viewed by copy/pasting the URL in column BF into a browser, then see Service Fees (at the top), “Amazon Partnered Carrier estimated shipping cost:” Be sure to add any manual processing fees and Labeling & Prep fees into the total.
OR by going to Inventory > Manage FBA Shipments, search for the fba-shipment-id
When the Actual Shipping Cost is filled in, it should look something like this:
This is because the spreadsheet is using styles that you may not have or there is something else that you version of Excel does not recognize.
Choose “Open and Repair”
If the entire spreadsheet is does not have any formatting and you use Excel for Mac, please make sure that there are no conflicting fonts in Font Book.
This may be because of the charts, or you need to update to the latest version of Excel for Mac.
Choose “Open as Read-Only”. After doing so, save a copy of the spreadsheet.
The Ultimate Sales Spreadsheet will work properly on Amazon properties that output their reports in English.
Currently the spreadsheet will work with:
- Amazon.com
- Amazon.ca
- Amazon.co.uk (separate version)
The spreadsheet will NOT work with:
- Amazon.com.mx
- Amazon.de
- Amazon.fr
- Amazon.it
- Amazon.es
- Amazon.co.jp
- Amazon.cn
- Amazon.in
If you attempt to use the spreadsheet with non-English reports, it will not calculate Returns, and detailed fees properly because it is looking for specific English phrases in the reports to categorize those fees.
You must have separate spreadsheets between properties unless you combine reports before entering them into the spreadsheet.
This warning comes up because the Spreadsheet connects to local Amazon reports (that you’ve previously connected to the spreadsheet), and because macros are used. You’ll want to click Enable Content. Otherwise, the spreadsheet will not update correctly after data is added.
The lite version of the Reimbursement Checker, Inventory Value Calculator, and Tax Summary spreadsheets will work with LibreOffice or OpenOffice, with the exception that you’ll have to manually paste in the reports that are downloaded from Amazon.
Unfortunately, the macros and pivot tables that are used in all other spreadsheets will not run properly in LibreOffice, OpenOffice, or Google Sheets.
Some sheets in our spreadsheets are locked for editing to make sure that certain underlying formulas aren’t accidentally deleted. If you simply need to copy data, you may have gotten the password message when right clicking on a cell. Instead, simply ctrl+c to copy.
If you would like to edit or remove data, we recommend either using the filter option drop down located at the top of the column next to the heading, or removing data from a file before importing. If you choose the latter, it may be easier to import it into a another (new) spreadsheet first, remove data, save as the same file type, then re-import into the spreadsheet.
If you want to add your own calculations/data to a spreadsheet, you can still do so by following these steps.
For v1:
More than likely the two SKU’s are slightly different. Compare the two SKU’s, and make sure there are:
- no leading 0’s
- no spaces
- no 0’s (zero) that are O’s (oh) or I’s (eye) that are l’s (el) or 1’s (one)
If a difference is found, find it on the PO data sheet and change it to match the SKU is in the sales data.
When the change is made click update on the Dashboard and everything should refresh. (you may have to click it twice)
For v2:
This will happen when the name of the item has changed at some point or multiple times. There may also be adjustments descriptions. This is normal due to the way we are finding unique names within sales data.
This is a running total. It is the amount of that SKU sold up until that point in time. This field is used to compare to the quantity (on the PO sheets) for the price calculation.
You must enter SKU data on the PO Data sheet for every SKU you sell in order for data to populate in the PO Sum & Prod Summary sheet.
If you receive a return and decide that it is sellable, change column N to “Yes” on the Returns sheet for that item. This will put it back into inventory. If you return it to Amazon under a different SKU, do not change column N – enter that SKU on the corresponding monthly PO sheet.
Sellable returns subtract from the amount sold. Reimbursements & non-sellable returns add to the amount sold. Return numbers are adjusted in the month that the item is returned. COGS are also adjusted accordingly.
Absolutely! As long as you can copy in the SKU, Quantity, and Cost. Optionally you can enter the shipping cost according to the instructions on the PO Data sheet.
There are a few things to check:
- Make sure there is an entry for that SKU on the PO data sheet. If there is, make sure that the number is entered exactly as it appears in the Sales Data. There could be a leading 0 or a space that you can’t see.
When pasting in SKU’s into the PO data sheet, make sure to choose ‘match destination formatting’. Even if you use only numbers for SKU’s they must remain as text, otherwise Excel will not match them correctly. If you’ve accidentally changed the SKU to format as numbers, right click the SKU, choose format and select text.Starting with v1.9, the proper formatting is automatically applied each time the “Load/Refresh ALL data” button on the Dashboard is pressed.- If you sold more than the total quantity entered, then the cost of items after that quantity will populate as $0.00. In this case the total available will be negative on the Prod Summary sheet. Increase the quantity for that SKU on the PO data sheet, or add the most recent PO Data
- Go to the Dashboard and click “Load/Refresh ALL data” again. Sometimes when new data is added it does not refresh other tables in an order that catches all of the individual changes.
- If none of this works, download the latest version of the spreadsheet. We’ve made improvements in the most recent versions that fix various forms of SKUs (for example, spaces) that were causing issues in past versions.
This part will require some manual entry if you do not already have PO data in a similar format. The important thing is that the SKU matches the SKU in the imported Amazon data.
An easy way to get a list of SKU and Title, the monthly Sum (Summary) sheets contain product lists for that month. It can simply be copied into the PO sheet, and the cost price and quantity can be added.
If you are having trouble with COGS data populating see this entry.
The spreadsheet will handle 13 different prices per SKU – one for the previous year inventory and one for each month. If a SKU is purchased for different prices in a single month, the average of those prices will be used.
If you want a more exact COGS for that SKU, change the date for that PO entry to a month that you did not purchase that item, or to a month with the same price. Just don’t forget that this will affect your PO purchase data for that month.
For v1 there is a maximum of 6000 sales a month, across 1000 unique SKU’s a month (72,000 sales total), and 5000 unique SKU’s total.
For v2 the max sales are limited by Excel (1 million rows of sales data) and your computer. If you have over 100,000 sales a year, we highly recommend 64 bit Excel and lots of memory.
If you have Excel for PC:
You have to press a button to do so, YES! In v2.1 we introduced a feature that automatically downloads the reports that the spreadsheet needs. Depending on the amount of data you have, this can take some time to complete.
Sales, Returns, Reimbursements, Detail Page data, Advertising, and FBA Shipping Data is downloaded with this feature.
When you need to update data, it only requests the days between when you last updated data and yesterday’s date.
Sorry, this feature does not work with Excel for Mac because it uses automation features only available with MS Internet Explorer.
If you have Excel for Mac:
In order for the spreadsheet to update your data, you must download the sales reports from Amazon, then import them into the spreadsheet. This is done with a few simple clicks.
Optionally, you can load other reports like Returns, Reimbursements, Detail Page data, Advertising, and FBA Shipping Data to view more statistics.
Sorry, no. The spreadsheet uses very complex formulas, macros, and pivot tables that Google Sheets does not support.
Yes! However, the charts on the Dashboard, Daily Sum & Advertising sheets will not function since Excel for Mac does not support Pivot Charts.
Also, note that if you are using an older version of Excel for Mac 2016, the spreadsheet may not function correctly. We recommend the latest release of Excel for Mac 2011 or 2016.
For the sales reports:
- Go to Reports > Payments > Date Range Reports (tab) > Generate a report
- Under “Select report type” select Transaction, then Generate
- After the report is generated, download it to a known folder on your computer
For the returns report:
- Go to Reports > Fulfillment > Returns > Download Tab
- Select the date range starting at Jan 1st up to the date you currently have data for, then Generate Report
- After the report is generated, download it to a known folder on your computer